Chapter 5 富集分析
Enrichment Using clusterprofiler based on enrich.html
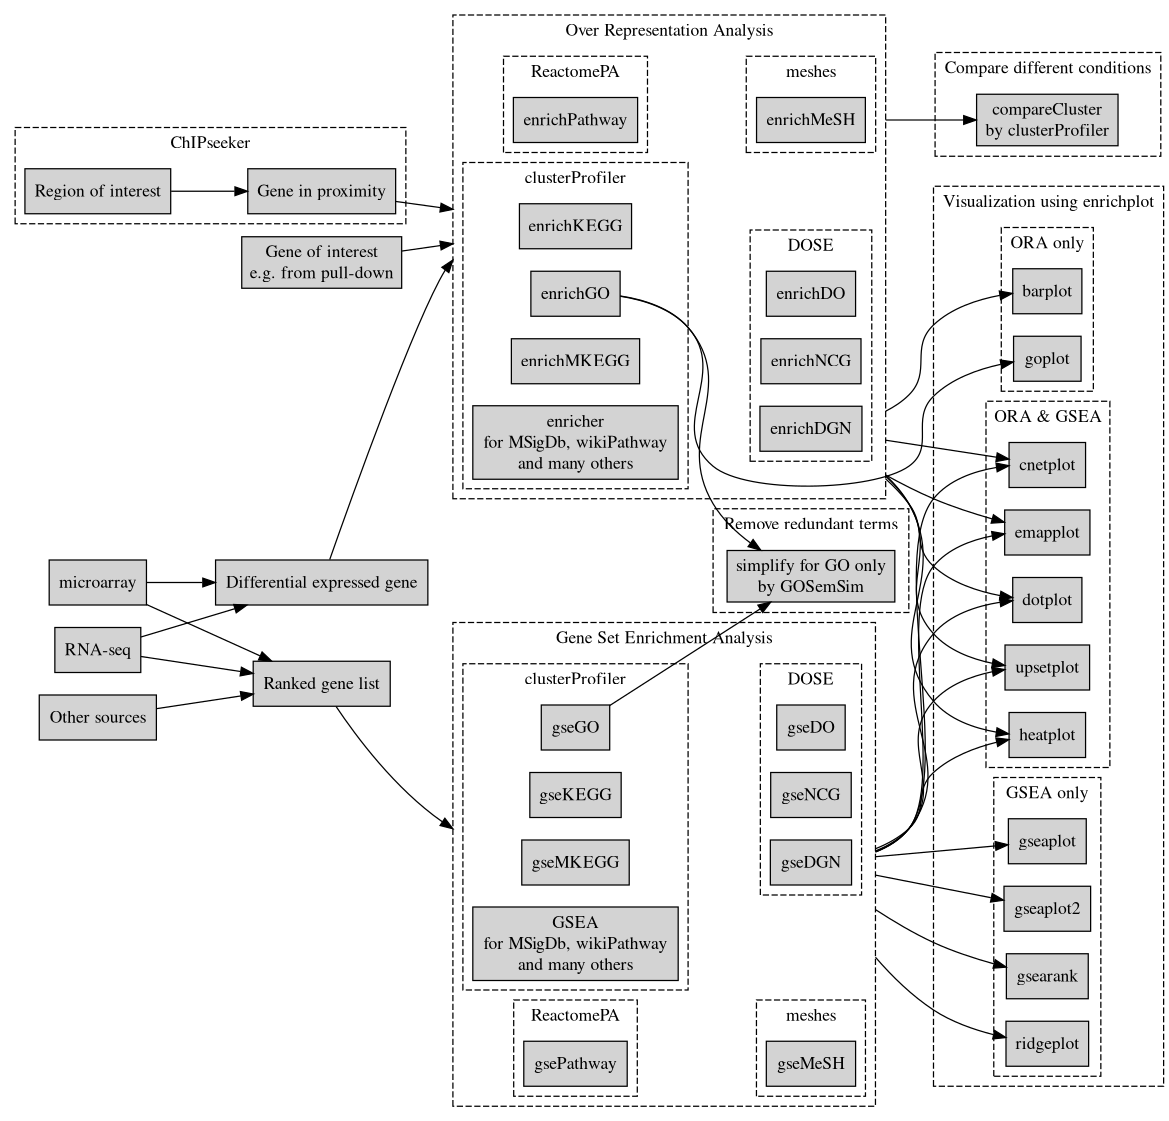
clusterProfiler-diagram
ref: http://yulab-smu.top/clusterProfiler-book/index.html
5.1 获取差异基因
library(Seurat)
pbmc <- readRDS("./data/PRO_seurat.RDS")

pbmc@meta.data$celltype <- pbmc@active.ident
#获取细胞间的差异基因
cells1 <- subset(pbmc@meta.data, celltype %in% c("CD14+ Mono"))  %>% rownames()
cells2 <- subset(pbmc@meta.data, celltype %in%  c("FCGR3A+ Mono"))  %>% rownames()
deg <- FindMarkers(pbmc, ident.1 = cells1, ident.2 = cells2)
deg <- data.frame(gene = rownames(deg), deg)
head(deg)
## gene p_val avg_log2FC pct.1 pct.2 p_val_adj
## FCGR3A FCGR3A 1.097516e-116 -4.287857 0.046 0.981 3.593049e-112
## CFD CFD 2.601448e-114 -3.500834 0.026 0.944 8.516621e-110
## IFITM3 IFITM3 1.629039e-113 -3.880574 0.055 0.981 5.333147e-109
## FCER1G FCER1G 1.997252e-112 -4.859236 0.092 1.000 6.538605e-108
## TYROBP TYROBP 4.882748e-106 -4.782237 0.138 1.000 1.598514e-101
## CD68 CD68 1.556965e-105 -3.043349 0.044 0.919 5.097192e-101deg1 <- deg
logFC_t=0.5
P.Value_t = 0.05
k1 = (deg1$p_val_adj < P.Value_t)&(deg1$avg_log2FC < -logFC_t)
k2 = (deg1$p_val_adj < P.Value_t)&(deg1$avg_log2FC > logFC_t)
table(k1)## k1
## FALSE TRUE
## 1376 540table(k2)## k2
## FALSE TRUE
## 1712 204#分组 上调/下调
change = ifelse(k1,"down",ifelse(k2,"up","stable"))
deg1$change <- change
head(deg1)## gene p_val avg_log2FC pct.1 pct.2 p_val_adj change
## FCGR3A FCGR3A 1.097516e-116 -4.287857 0.046 0.981 3.593049e-112 down
## CFD CFD 2.601448e-114 -3.500834 0.026 0.944 8.516621e-110 down
## IFITM3 IFITM3 1.629039e-113 -3.880574 0.055 0.981 5.333147e-109 down
## FCER1G FCER1G 1.997252e-112 -4.859236 0.092 1.000 6.538605e-108 down
## TYROBP TYROBP 4.882748e-106 -4.782237 0.138 1.000 1.598514e-101 down
## CD68 CD68 1.556965e-105 -3.043349 0.044 0.919 5.097192e-101 down#基因名称转换
library("clusterProfiler")## ## clusterProfiler v3.18.1 For help: https://guangchuangyu.github.io/software/clusterProfiler
##
## If you use clusterProfiler in published research, please cite:
## Guangchuang Yu, Li-Gen Wang, Yanyan Han, Qing-Yu He. clusterProfiler: an R package for comparing biological themes among gene clusters. OMICS: A Journal of Integrative Biology. 2012, 16(5):284-287.##
## Attaching package: 'clusterProfiler'## The following object is masked from 'package:purrr':
##
## simplify## The following object is masked from 'package:stats':
##
## filterlibrary("org.Hs.eg.db")## Loading required package: AnnotationDbi## Loading required package: stats4## Loading required package: BiocGenerics## Loading required package: parallel##
## Attaching package: 'BiocGenerics'## The following objects are masked from 'package:parallel':
##
## clusterApply, clusterApplyLB, clusterCall, clusterEvalQ,
## clusterExport, clusterMap, parApply, parCapply, parLapply,
## parLapplyLB, parRapply, parSapply, parSapplyLB## The following objects are masked from 'package:dplyr':
##
## combine, intersect, setdiff, union## The following objects are masked from 'package:stats':
##
## IQR, mad, sd, var, xtabs## The following objects are masked from 'package:base':
##
## anyDuplicated, append, as.data.frame, basename, cbind, colnames,
## dirname, do.call, duplicated, eval, evalq, Filter, Find, get, grep,
## grepl, intersect, is.unsorted, lapply, Map, mapply, match, mget,
## order, paste, pmax, pmax.int, pmin, pmin.int, Position, rank,
## rbind, Reduce, rownames, sapply, setdiff, sort, table, tapply,
## union, unique, unsplit, which.max, which.min## Loading required package: Biobase## Welcome to Bioconductor
##
## Vignettes contain introductory material; view with
## 'browseVignettes()'. To cite Bioconductor, see
## 'citation("Biobase")', and for packages 'citation("pkgname")'.## Loading required package: IRanges## Loading required package: S4Vectors##
## Attaching package: 'S4Vectors'## The following object is masked from 'package:clusterProfiler':
##
## rename## The following objects are masked from 'package:dplyr':
##
## first, rename## The following object is masked from 'package:tidyr':
##
## expand## The following object is masked from 'package:base':
##
## expand.grid##
## Attaching package: 'IRanges'## The following object is masked from 'package:clusterProfiler':
##
## slice## The following objects are masked from 'package:dplyr':
##
## collapse, desc, slice## The following object is masked from 'package:purrr':
##
## reduce##
## Attaching package: 'AnnotationDbi'## The following object is masked from 'package:clusterProfiler':
##
## select## The following object is masked from 'package:dplyr':
##
## select## s2e <- bitr(deg1$gene,
fromType = "SYMBOL",
toType = "ENTREZID",
OrgDb = org.Hs.eg.db)#人类 转换成ENTREZID## 'select()' returned 1:1 mapping between keys and columns## Warning in bitr(deg1$gene, fromType = "SYMBOL", toType = "ENTREZID", OrgDb =
## org.Hs.eg.db): 6.68% of input gene IDs are fail to map...library(dplyr)
deg1 <- inner_join(deg1,s2e,by=c("gene"="SYMBOL"))
head(deg1)## gene p_val avg_log2FC pct.1 pct.2 p_val_adj change ENTREZID
## 1 FCGR3A 1.097516e-116 -4.287857 0.046 0.981 3.593049e-112 down 2214
## 2 CFD 2.601448e-114 -3.500834 0.026 0.944 8.516621e-110 down 1675
## 3 IFITM3 1.629039e-113 -3.880574 0.055 0.981 5.333147e-109 down 10410
## 4 FCER1G 1.997252e-112 -4.859236 0.092 1.000 6.538605e-108 down 2207
## 5 TYROBP 4.882748e-106 -4.782237 0.138 1.000 1.598514e-101 down 7305
## 6 CD68 1.556965e-105 -3.043349 0.044 0.919 5.097192e-101 down 968#GO富集分析差异基因列表[Symbol]
gene_up = deg1[deg1$change == 'up','gene']
gene_down = deg1[deg1$change == 'down','gene']
gene_diff = c(gene_up,gene_down)
#KEGG富集分析差异基因列表[ENTREZID]
gene_all = deg1[,'ENTREZID']
gene_up_KEGG = deg1[deg1$change == 'up','ENTREZID']
gene_down_KEGG = deg1[deg1$change == 'down','ENTREZID']
gene_diff_KEGG = c(gene_up_KEGG,gene_down_KEGG)5.2 GO富集分析
5.2.1 GO富集分析
#细胞组分
ego_CC <- enrichGO(gene          = gene_up,
                  keyType       = 'SYMBOL', #基因ID的类型
                OrgDb         = org.Hs.eg.db,  #包含人注释信息的数据库
                ont           = "CC",
                pAdjustMethod = "BH", #指定多重假设检验矫正的方法
                pvalueCutoff  = 0.01,
                qvalueCutoff  = 0.05)
head(summary(ego_CC))
## Warning in summary(ego_CC): summary method to convert the object to data.frame
## is deprecated, please use as.data.frame instead.## ID Description GeneRatio BgRatio
## GO:0022626 GO:0022626 cytosolic ribosome 66/192 110/19559
## GO:0044391 GO:0044391 ribosomal subunit 66/192 187/19559
## GO:0005840 GO:0005840 ribosome 66/192 270/19559
## GO:0022625 GO:0022625 cytosolic large ribosomal subunit 39/192 58/19559
## GO:0015934 GO:0015934 large ribosomal subunit 39/192 116/19559
## GO:0022627 GO:0022627 cytosolic small ribosomal subunit 27/192 47/19559
## pvalue p.adjust qvalue
## GO:0022626 8.168314e-108 1.895049e-105 1.693850e-105
## GO:0044391 1.478001e-87 1.714481e-85 1.532453e-85
## GO:0005840 2.456292e-75 1.899533e-73 1.697858e-73
## GO:0022625 6.530221e-66 3.787528e-64 3.385404e-64
## GO:0015934 5.056823e-50 2.346366e-48 2.097251e-48
## GO:0022627 7.513437e-43 2.905196e-41 2.596749e-41
## geneID
## GO:0022626 RPS18/RPS27/RPS3/RPL13A/RPL3/RPL13/RPS27A/RPS25/RPS12/RPL23A/RPSA/RPLP2/RPS15A/RPS6/RPL31/RPL9/RPL32/RPS29/RPLP0/RPS8/RPL30/RPL11/RPL27A/RPS7/RPS14/RPS10/RPL35A/RPLP1/RPL5/RPL19/RPS3A/RPS20/RPS4X/RPS5/RPL10A/RPL36/RPS28/RPS2/RPS13/RPL10/RPL14/RPL17/RPL15/RPS16/RPL21/RPL6/RPS23/RPS15/RPL7A/RPL18/RPL18A/RPL35/RPS26/RPS21/RPL37A/RPL4/RPL29/RPL27/RPL7/RPL24/RPL37/RPS4Y1/RPL38/RPL22/RPL36A/RPL34
## GO:0044391 RPS18/RPS27/RPS3/RPL13A/RPL3/RPL13/RPS27A/RPS25/RPS12/RPL23A/RPSA/RPLP2/RPS15A/RPS6/RPL31/RPL9/RPL32/RPS29/RPLP0/RPS8/RPL30/RPL11/RPL27A/RPS7/RPS14/RPS10/RPL35A/RPLP1/RPL5/RPL19/RPS3A/RPS20/RPS4X/RPS5/RPL10A/RPL36/RPS28/RPS2/RPS13/RPL10/RPL14/RPL17/RPL15/RPS16/RPL21/RPL6/RPS23/RPS15/RPL7A/RPL18/RPL18A/RPL35/RPS26/RPS21/RPL37A/RPL4/RPL29/RPL27/RPL7/RPL24/RPL37/RPS4Y1/RPL38/RPL22/RPL36A/RPL34
## GO:0005840 RPS18/RPS27/RPS3/RPL13A/RPL3/RPL13/RPS27A/RPS25/RPS12/RPL23A/RPSA/RPLP2/RPS15A/RPS6/RPL31/RPL9/RPL32/RPS29/RPLP0/RPS8/RPL30/RPL11/RPL27A/RPS7/RPS14/RPS10/RPL35A/RPLP1/RPL5/RPL19/RPS3A/RPS20/RPS4X/RPS5/RPL10A/RPL36/RPS28/RPS2/RPS13/RPL10/RPL14/RPL17/RPL15/RPS16/RPL21/RPL6/RPS23/RPS15/RPL7A/RPL18/RPL18A/RPL35/RPS26/RPS21/RPL37A/RPL4/RPL29/RPL27/RPL7/RPL24/RPL37/RPS4Y1/RPL38/RPL22/RPL36A/RPL34
## GO:0022625 RPL13A/RPL3/RPL13/RPL23A/RPLP2/RPL31/RPL9/RPL32/RPLP0/RPL30/RPL11/RPL27A/RPL35A/RPLP1/RPL5/RPL19/RPL10A/RPL36/RPL10/RPL14/RPL17/RPL15/RPL21/RPL6/RPL7A/RPL18/RPL18A/RPL35/RPL37A/RPL4/RPL29/RPL27/RPL7/RPL24/RPL37/RPL38/RPL22/RPL36A/RPL34
## GO:0015934 RPL13A/RPL3/RPL13/RPL23A/RPLP2/RPL31/RPL9/RPL32/RPLP0/RPL30/RPL11/RPL27A/RPL35A/RPLP1/RPL5/RPL19/RPL10A/RPL36/RPL10/RPL14/RPL17/RPL15/RPL21/RPL6/RPL7A/RPL18/RPL18A/RPL35/RPL37A/RPL4/RPL29/RPL27/RPL7/RPL24/RPL37/RPL38/RPL22/RPL36A/RPL34
## GO:0022627 RPS18/RPS27/RPS3/RPS27A/RPS25/RPS12/RPSA/RPS15A/RPS6/RPS29/RPS8/RPS7/RPS14/RPS10/RPS3A/RPS20/RPS4X/RPS5/RPS28/RPS2/RPS13/RPS16/RPS23/RPS15/RPS26/RPS21/RPS4Y1
## Count
## GO:0022626 66
## GO:0044391 66
## GO:0005840 66
## GO:0022625 39
## GO:0015934 39
## GO:0022627 27#生物过程
ego_BP <- enrichGO(gene = gene_up,
OrgDb = org.Hs.eg.db,
keyType = 'SYMBOL',
ont = "BP",
pAdjustMethod = "BH",
pvalueCutoff = 0.01,
qvalueCutoff = 0.05)
#分子功能
ego_MF <- enrichGO(gene = gene_up,
OrgDb = org.Hs.eg.db,
keyType = 'SYMBOL',
ont = "MF",
pAdjustMethod = "BH",
pvalueCutoff = 0.01,
qvalueCutoff = 0.05)
# save(ego_CC,ego_BP,ego_MF,file = "GO.Rdata")
#细胞组分、分子功能、生物学过程
go <- enrichGO(gene = gene_up, OrgDb = "org.Hs.eg.db", keyType = 'SYMBOL',ont="all")
head(go)## ONTOLOGY ID
## GO:0006614 BP GO:0006614
## GO:0006613 BP GO:0006613
## GO:0000184 BP GO:0000184
## GO:0045047 BP GO:0045047
## GO:0072599 BP GO:0072599
## GO:0070972 BP GO:0070972
## Description
## GO:0006614 SRP-dependent cotranslational protein targeting to membrane
## GO:0006613 cotranslational protein targeting to membrane
## GO:0000184 nuclear-transcribed mRNA catabolic process, nonsense-mediated decay
## GO:0045047 protein targeting to ER
## GO:0072599 establishment of protein localization to endoplasmic reticulum
## GO:0070972 protein localization to endoplasmic reticulum
## GeneRatio BgRatio pvalue p.adjust qvalue
## GO:0006614 66/186 105/18866 6.243599e-110 1.688894e-106 1.520809e-106
## GO:0006613 66/186 109/18866 2.744310e-108 3.711680e-105 3.342281e-105
## GO:0000184 66/186 120/18866 3.104015e-104 2.099090e-101 1.890182e-101
## GO:0045047 66/186 120/18866 3.104015e-104 2.099090e-101 1.890182e-101
## GO:0072599 66/186 124/18866 6.691966e-103 3.620354e-100 3.260044e-100
## GO:0070972 66/186 152/18866 4.734663e-95 2.134544e-92 1.922107e-92
## geneID
## GO:0006614 RPS18/RPS27/RPS3/RPL13A/RPL3/RPL13/RPS27A/RPS25/RPS12/RPL23A/RPSA/RPLP2/RPS15A/RPS6/RPL31/RPL9/RPL32/RPS29/RPLP0/RPS8/RPL30/RPL11/RPL27A/RPS7/RPS14/RPS10/RPL35A/RPLP1/RPL5/RPL19/RPS3A/RPS20/RPS4X/RPS5/RPL10A/RPL36/RPS28/RPS2/RPS13/RPL10/RPL14/RPL17/RPL15/RPS16/RPL21/RPL6/RPS23/RPS15/RPL7A/RPL18/RPL18A/RPL35/RPS26/RPS21/RPL37A/RPL4/RPL29/RPL27/RPL7/RPL24/RPL37/RPS4Y1/RPL38/RPL22/RPL36A/RPL34
## GO:0006613 RPS18/RPS27/RPS3/RPL13A/RPL3/RPL13/RPS27A/RPS25/RPS12/RPL23A/RPSA/RPLP2/RPS15A/RPS6/RPL31/RPL9/RPL32/RPS29/RPLP0/RPS8/RPL30/RPL11/RPL27A/RPS7/RPS14/RPS10/RPL35A/RPLP1/RPL5/RPL19/RPS3A/RPS20/RPS4X/RPS5/RPL10A/RPL36/RPS28/RPS2/RPS13/RPL10/RPL14/RPL17/RPL15/RPS16/RPL21/RPL6/RPS23/RPS15/RPL7A/RPL18/RPL18A/RPL35/RPS26/RPS21/RPL37A/RPL4/RPL29/RPL27/RPL7/RPL24/RPL37/RPS4Y1/RPL38/RPL22/RPL36A/RPL34
## GO:0000184 RPS18/RPS27/RPS3/RPL13A/RPL3/RPL13/RPS27A/RPS25/RPS12/RPL23A/RPSA/RPLP2/RPS15A/RPS6/RPL31/RPL9/RPL32/RPS29/RPLP0/RPS8/RPL30/RPL11/RPL27A/RPS7/RPS14/RPS10/RPL35A/RPLP1/RPL5/RPL19/RPS3A/RPS20/RPS4X/RPS5/RPL10A/RPL36/RPS28/RPS2/RPS13/RPL10/RPL14/RPL17/RPL15/RPS16/RPL21/RPL6/RPS23/RPS15/RPL7A/RPL18/RPL18A/RPL35/RPS26/RPS21/RPL37A/RPL4/RPL29/RPL27/RPL7/RPL24/RPL37/RPS4Y1/RPL38/RPL22/RPL36A/RPL34
## GO:0045047 RPS18/RPS27/RPS3/RPL13A/RPL3/RPL13/RPS27A/RPS25/RPS12/RPL23A/RPSA/RPLP2/RPS15A/RPS6/RPL31/RPL9/RPL32/RPS29/RPLP0/RPS8/RPL30/RPL11/RPL27A/RPS7/RPS14/RPS10/RPL35A/RPLP1/RPL5/RPL19/RPS3A/RPS20/RPS4X/RPS5/RPL10A/RPL36/RPS28/RPS2/RPS13/RPL10/RPL14/RPL17/RPL15/RPS16/RPL21/RPL6/RPS23/RPS15/RPL7A/RPL18/RPL18A/RPL35/RPS26/RPS21/RPL37A/RPL4/RPL29/RPL27/RPL7/RPL24/RPL37/RPS4Y1/RPL38/RPL22/RPL36A/RPL34
## GO:0072599 RPS18/RPS27/RPS3/RPL13A/RPL3/RPL13/RPS27A/RPS25/RPS12/RPL23A/RPSA/RPLP2/RPS15A/RPS6/RPL31/RPL9/RPL32/RPS29/RPLP0/RPS8/RPL30/RPL11/RPL27A/RPS7/RPS14/RPS10/RPL35A/RPLP1/RPL5/RPL19/RPS3A/RPS20/RPS4X/RPS5/RPL10A/RPL36/RPS28/RPS2/RPS13/RPL10/RPL14/RPL17/RPL15/RPS16/RPL21/RPL6/RPS23/RPS15/RPL7A/RPL18/RPL18A/RPL35/RPS26/RPS21/RPL37A/RPL4/RPL29/RPL27/RPL7/RPL24/RPL37/RPS4Y1/RPL38/RPL22/RPL36A/RPL34
## GO:0070972 RPS18/RPS27/RPS3/RPL13A/RPL3/RPL13/RPS27A/RPS25/RPS12/RPL23A/RPSA/RPLP2/RPS15A/RPS6/RPL31/RPL9/RPL32/RPS29/RPLP0/RPS8/RPL30/RPL11/RPL27A/RPS7/RPS14/RPS10/RPL35A/RPLP1/RPL5/RPL19/RPS3A/RPS20/RPS4X/RPS5/RPL10A/RPL36/RPS28/RPS2/RPS13/RPL10/RPL14/RPL17/RPL15/RPS16/RPL21/RPL6/RPS23/RPS15/RPL7A/RPL18/RPL18A/RPL35/RPS26/RPS21/RPL37A/RPL4/RPL29/RPL27/RPL7/RPL24/RPL37/RPS4Y1/RPL38/RPL22/RPL36A/RPL34
## Count
## GO:0006614 66
## GO:0006613 66
## GO:0000184 66
## GO:0045047 66
## GO:0072599 66
## GO:0070972 665.2.2 GO富集结果可视化
dotplot(ego_CC, showCategory=30)## wrong orderBy parameter; set to default `orderBy = "x"`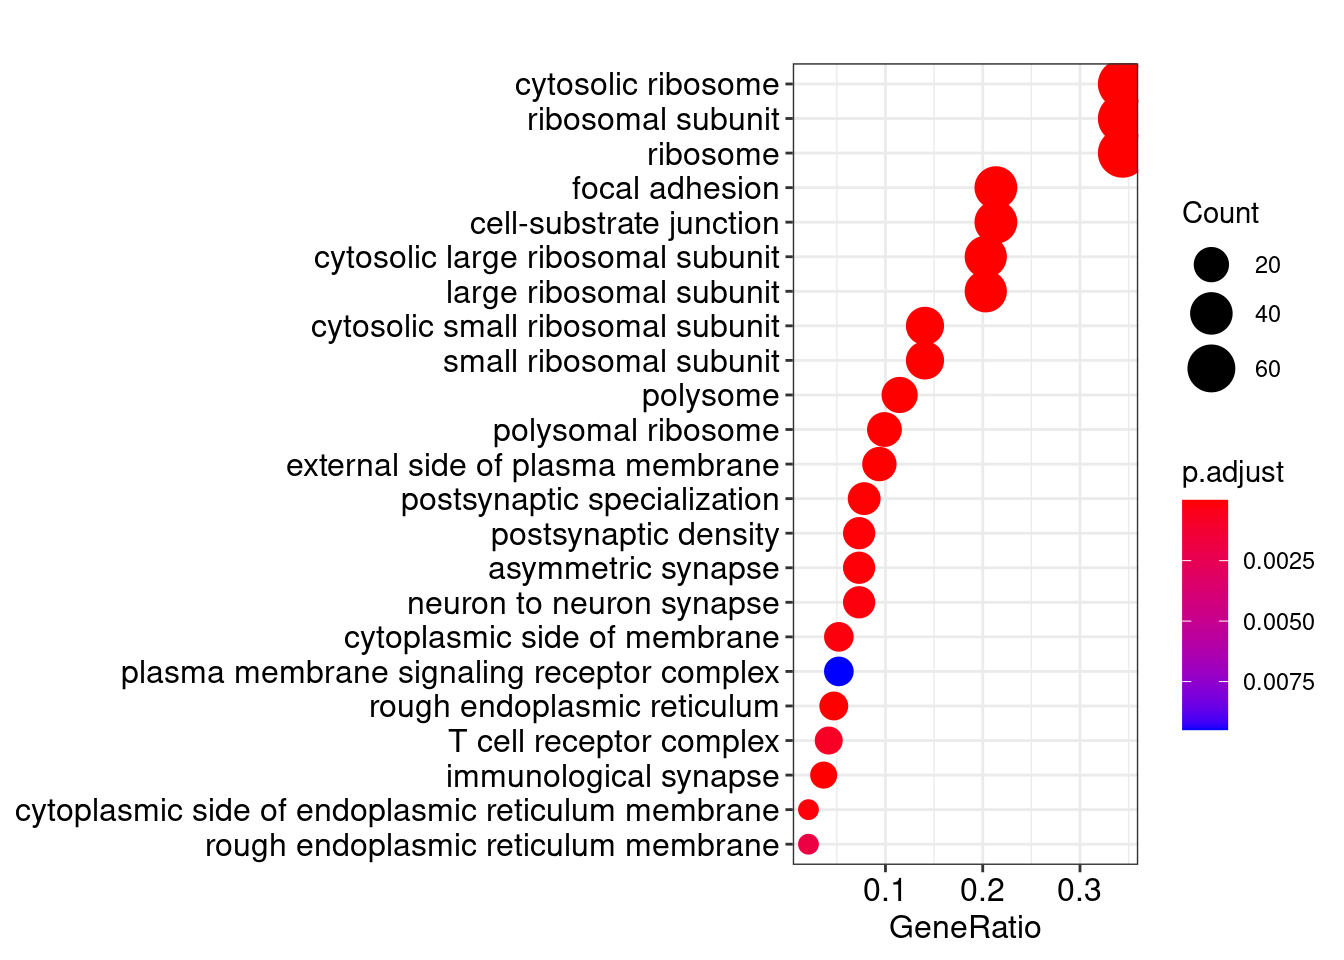
barplot(ego_CC)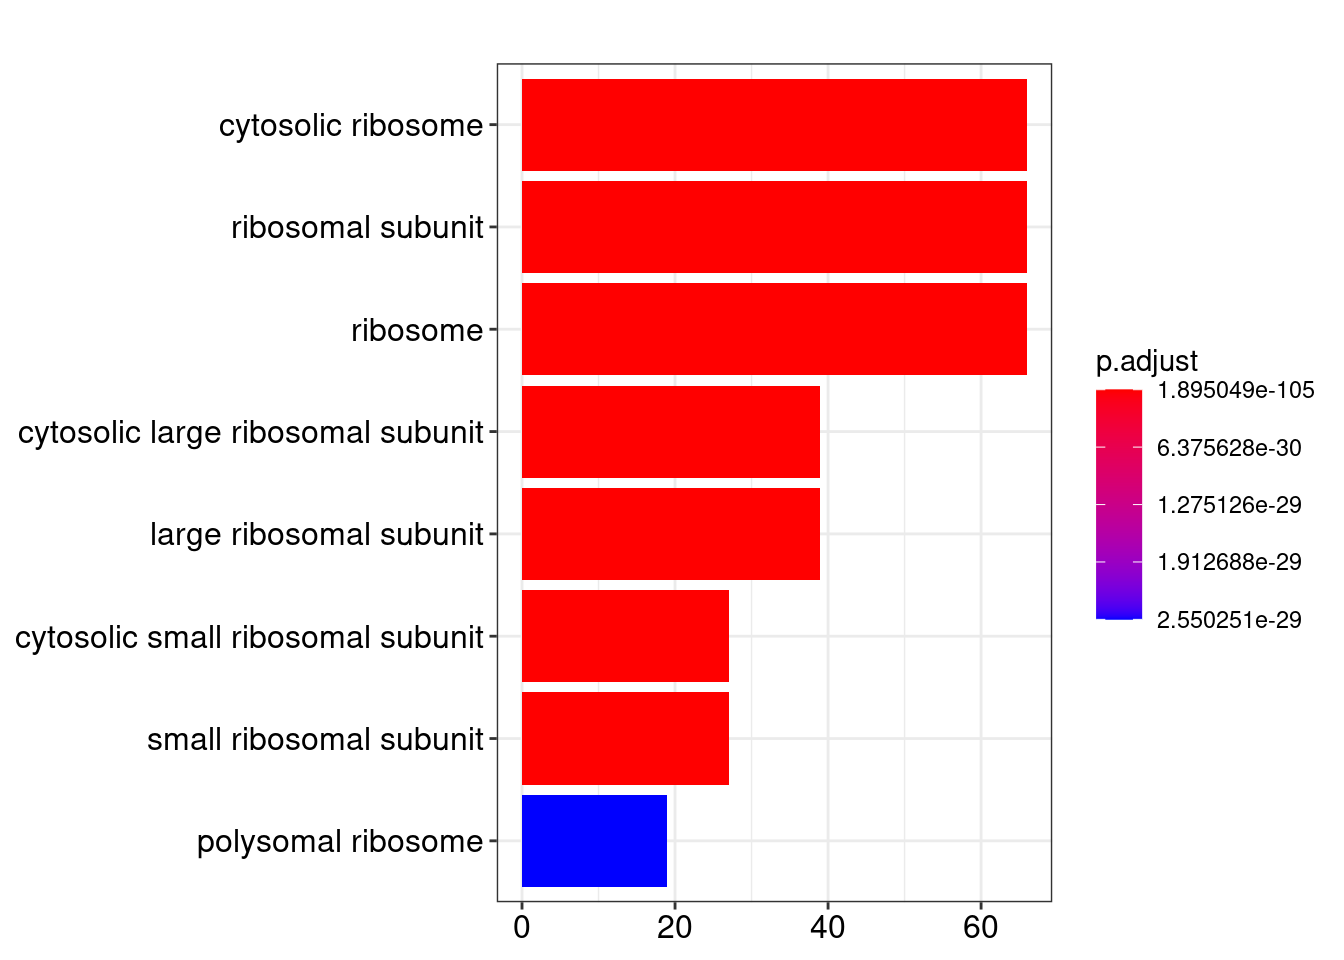
library(ggplot2)
p <- dotplot(go, split="ONTOLOGY") +facet_grid(ONTOLOGY~., scale="free")
## wrong orderBy parameter; set to default `orderBy = "x"`p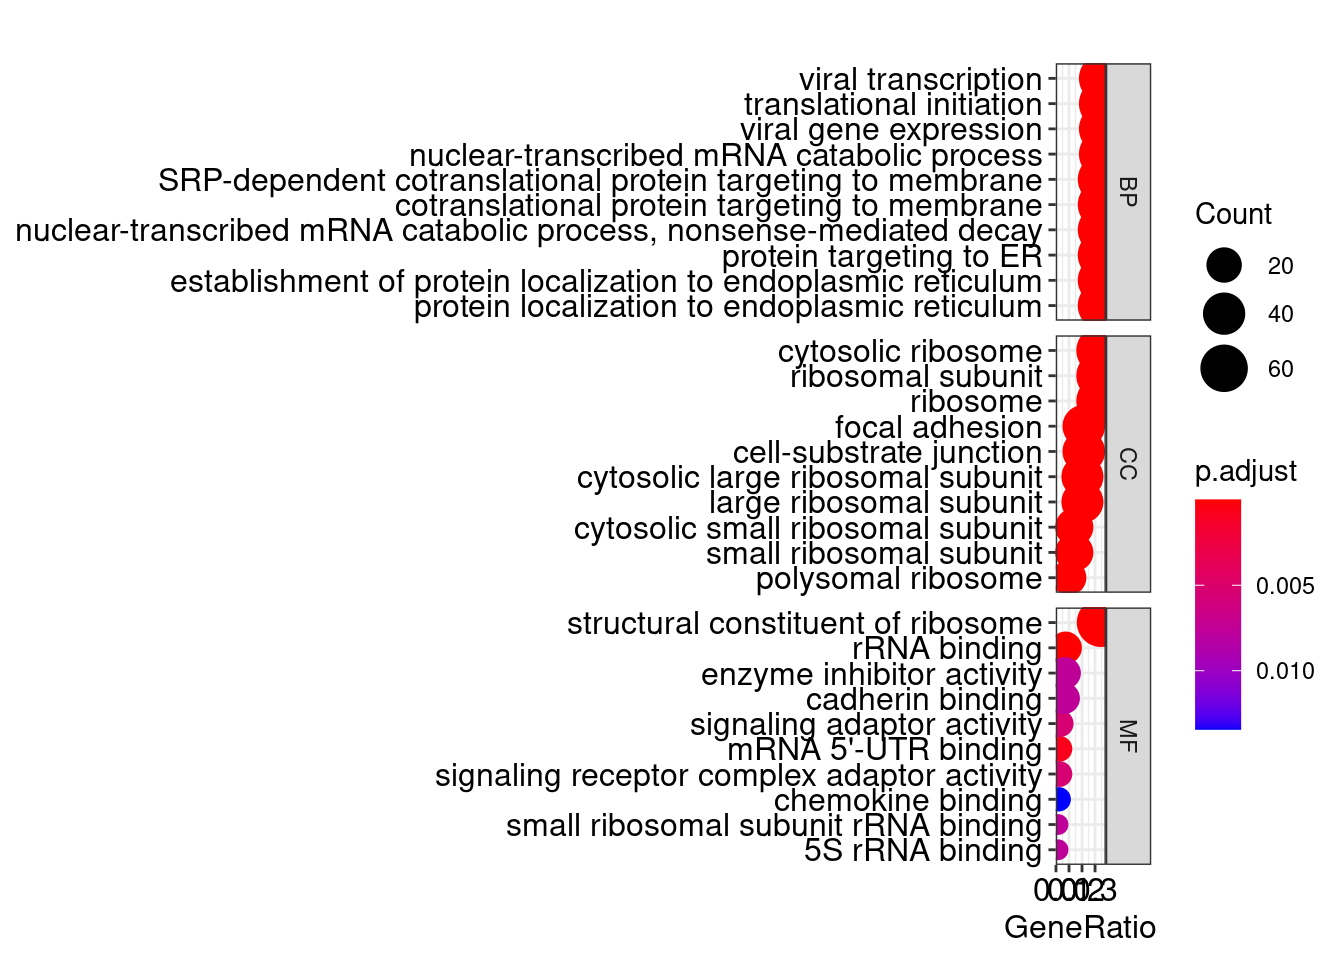 ### DAG有向无环图
library(topGO)## Loading required package: graph##
## Attaching package: 'graph'## The following object is masked from 'package:stringr':
##
## boundary## Loading required package: GO.db## Loading required package: SparseM##
## Attaching package: 'SparseM'## The following object is masked from 'package:base':
##
## backsolve##
## groupGOTerms: GOBPTerm, GOMFTerm, GOCCTerm environments built.##
## Attaching package: 'topGO'## The following object is masked from 'package:IRanges':
##
## membersplotGOgraph(ego_MF) #矩形代表富集到的top10个GO terms, 颜色从黄色过滤到红色,对应p值从大到小。##
## groupGOTerms: GOBPTerm, GOMFTerm, GOCCTerm environments built.##
## Building most specific GOs .....## ( 541 GO terms found. )##
## Build GO DAG topology ..........## ( 541 GO terms and 676 relations. )##
## Annotating nodes ...............## ( 18352 genes annotated to the GO terms. )## Loading required package: Rgraphviz## Loading required package: grid##
## Attaching package: 'grid'## The following object is masked from 'package:topGO':
##
## depth##
## Attaching package: 'Rgraphviz'## The following objects are masked from 'package:IRanges':
##
## from, to## The following objects are masked from 'package:S4Vectors':
##
## from, to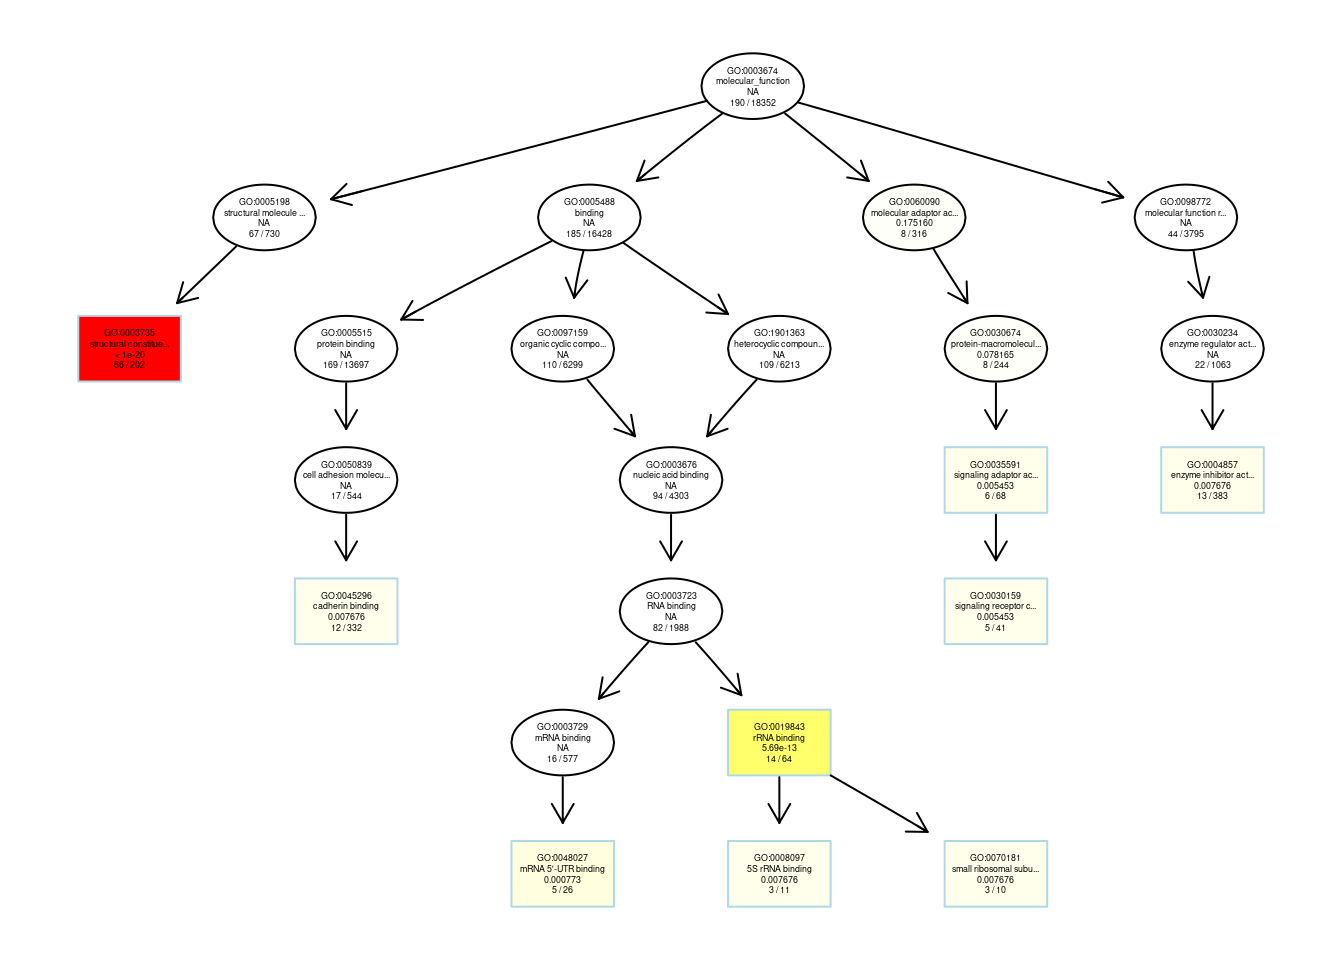
## $dag
## A graphNEL graph with directed edges
## Number of Nodes = 23
## Number of Edges = 23
##
## $complete.dag
## [1] "A graph with 23 nodes."
#igraph布局的DAG
# goplot(go)
#GO terms关系网络图(通过差异基因关联)
# emapplot(go, showCategory = 30)
#GO term与差异基因关系网络图
cnetplot(go, showCategory = 5)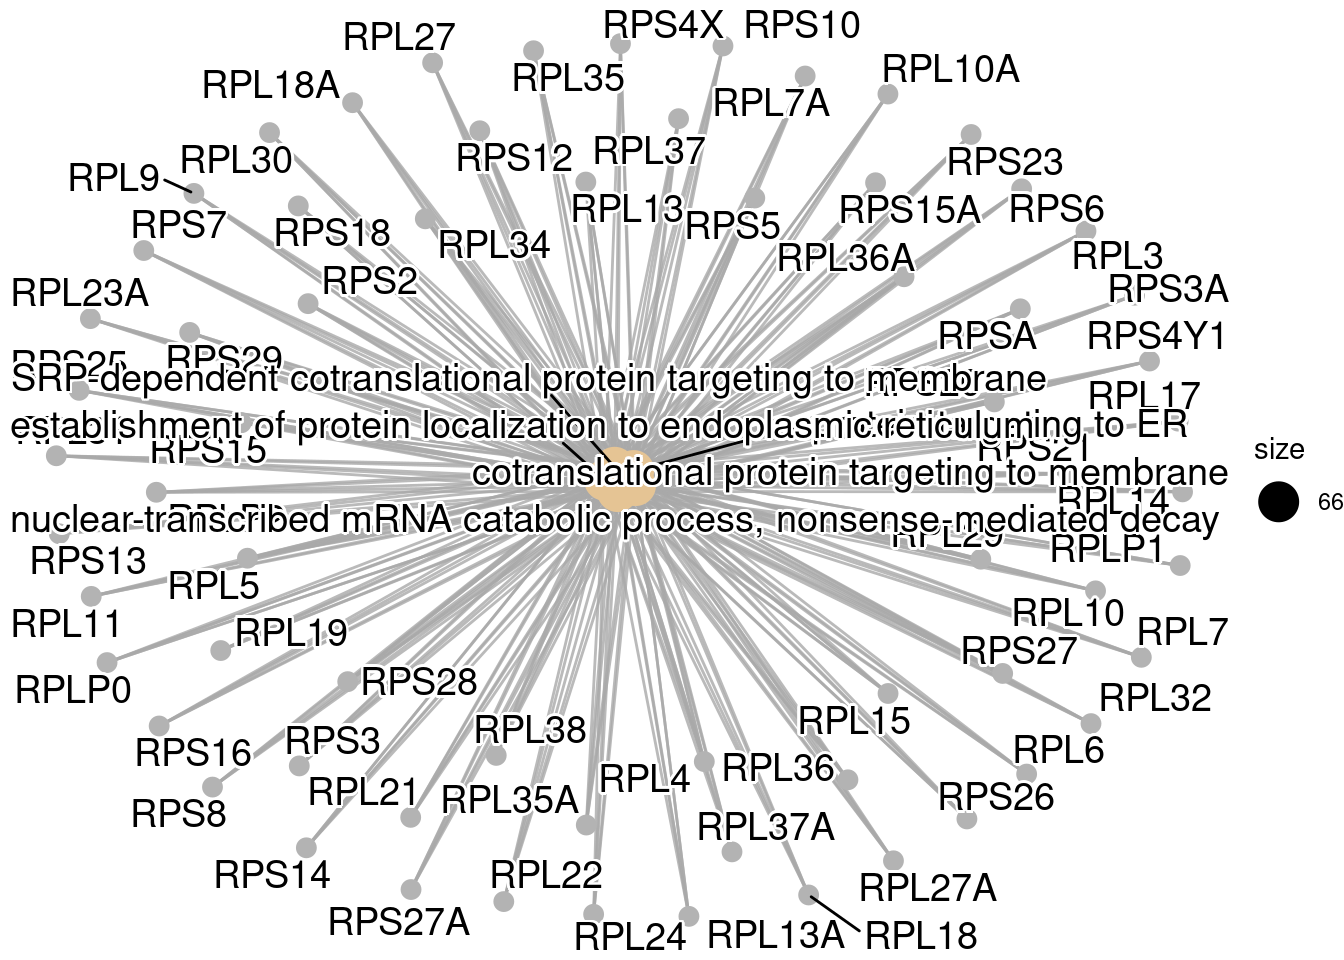
5.3 KEGG富集分析
5.3.1 KEGG富集分析代码
#上调基因富集
# use use_internal_data to fast
kk.up <- enrichKEGG(gene         = gene_up_KEGG, #注意这里只能用 entrzeid
                      organism     = 'hsa',
                      universe     = gene_all, ##背景基因集,可省
                      pvalueCutoff = 0.9, ##指定 p 值阈值,不显著的值将不显示在结果中
                      qvalueCutoff = 0.9,
                      use_internal_data=TRUE)

#下调基因富集
kk.down <- enrichKEGG(gene         =  gene_down_KEGG,
                        organism     = 'hsa',
                        universe     = gene_all,
                        pvalueCutoff = 0.9,
                        qvalueCutoff =0.9,
                        use_internal_data=TRUE)
kk.diff <- enrichKEGG(gene         = gene_diff_KEGG,
                        organism     = 'hsa',
                        pvalueCutoff = 0.9,
                        use_internal_data=TRUE)
# save(kk.diff,kk.down,kk.up,file = "GSE4107kegg.Rdata")

#从富集结果中提取结果数据框
ekegg <- setReadable(kk.up, OrgDb = org.Hs.eg.db, keyType="ENTREZID")
kegg_diff_dt <- data.frame(ekegg)
head(kegg_diff_dt)
## ID Description GeneRatio BgRatio
## hsa03010 hsa03010 Ribosome 66/126 73/811
## hsa05340 hsa05340 Primary immunodeficiency 7/126 12/811
## hsa04660 hsa04660 T cell receptor signaling pathway 10/126 27/811
## hsa04640 hsa04640 Hematopoietic cell lineage 7/126 20/811
## pvalue p.adjust qvalue
## hsa03010 3.982781e-53 2.787947e-51 2.766985e-51
## hsa05340 7.507294e-04 2.627553e-02 2.607797e-02
## hsa04660 4.626879e-03 1.079605e-01 1.071488e-01
## hsa04640 2.461933e-02 4.308383e-01 4.275990e-01
## geneID
## hsa03010 RPS18/RPS27/RPS3/RPL13A/RPL3/RPL13/RPS27A/RPS25/RPS12/RPL23A/RPSA/RPLP2/RPS15A/RPS6/RPL31/RPL9/RPL32/RPS29/RPLP0/RPS8/RPL30/RPL11/RPL27A/RPS7/RPS14/RPS10/RPL35A/RPLP1/RPL5/RPL19/RPS3A/RPS20/RPS4X/RPS5/RPL10A/RPL36/RPS28/RPS2/RPS13/RPL10/RPL14/RPL17/RPL15/RPS16/RPL21/RPL6/RPS23/RPS15/RPL7A/RPL18/RPL18A/RPL35/RPS26/RPS21/RPL37A/RPL4/RPL29/RPL27/RPL7/RPL24/RPL37/RPS4Y1/RPL38/RPL22/RPL36A/RPL34
## hsa05340 CD3D/CD3E/IL7R/LCK/IL2RG/CD40LG/ZAP70
## hsa04660 CD3D/CD3E/JUN/LCK/CD3G/LAT/CD247/CD40LG/ZAP70/GRAP2
## hsa04640 CD3D/CD3E/IL7R/CD2/CD7/CD3G/FLT3LG
## Count
## hsa03010 66
## hsa05340 7
## hsa04660 10
## hsa04640 75.3.2 KEGG结果可视化
p1 <- barplot(ekegg, showCategory=10)
p2 <- dotplot(ekegg, showCategory=10)
## wrong orderBy parameter; set to default `orderBy = "x"`plotc = p1/p2
plotc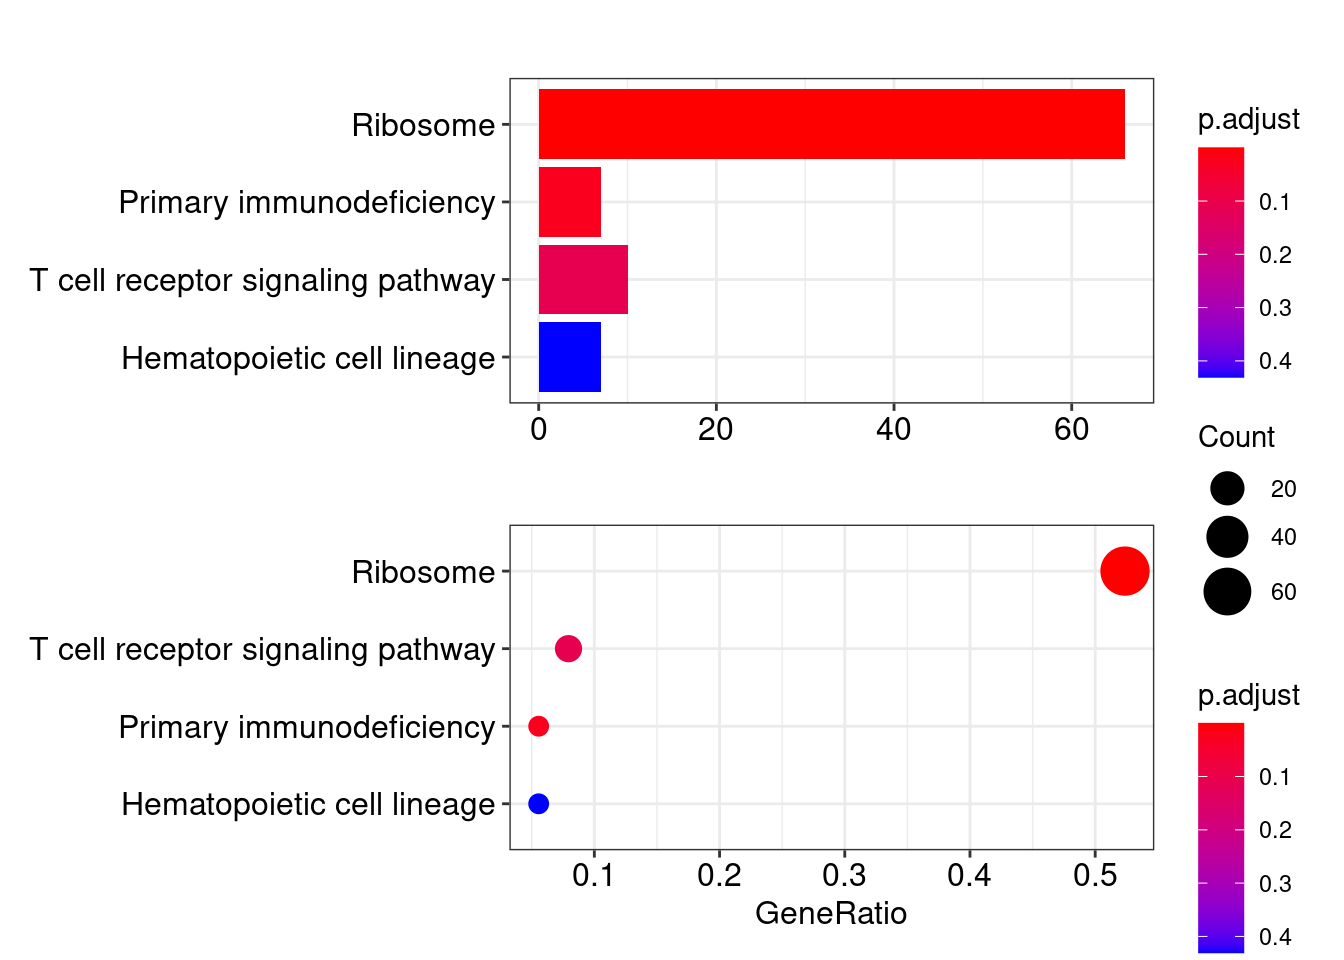
up_kegg <- kk.up@result %>%
  filter(pvalue<0.01) %>%
  mutate(group=1)

down_kegg <- kk.down@result %>%
  filter(pvalue<0.05) %>% #筛选行
  mutate(group=-1) #新增列
5.4 GSEA富集分析
5.4.1 GSEA富集
library(dplyr)
library(GSEABase)
## Loading required package: annotate## Loading required package: XML##
## Attaching package: 'XML'## The following object is masked from 'package:graph':
##
## addNode##
## Attaching package: 'annotate'## The following object is masked from 'package:Rgraphviz':
##
## toFile##
## Attaching package: 'GSEABase'## The following objects are masked from 'package:topGO':
##
## ontology, phenotypelibrary(org.Hs.eg.db)
library(ggplot2)
library(stringr)
library(enrichplot)
options(stringsAsFactors = F)
geneList = deg1$avg_log2FC
names(geneList) = deg1$gene
geneList = sort(geneList,decreasing = T)
geneList[1:10]## IL32 CD3D LTB PTPRCAP IL7R LDHB CD3E CD2
## 3.622858 3.271881 2.933899 2.696588 2.682289 2.678308 2.573389 2.346615
## LCK JUN
## 2.073253 2.013264geneset <- read.gmt("./data/h.all.v7.4.symbols.gmt")
geneset$term = str_remove(geneset$term,"HALLMARK_")
head(geneset)## term gene
## 1 TNFA_SIGNALING_VIA_NFKB JUNB
## 2 TNFA_SIGNALING_VIA_NFKB CXCL2
## 3 TNFA_SIGNALING_VIA_NFKB ATF3
## 4 TNFA_SIGNALING_VIA_NFKB NFKBIA
## 5 TNFA_SIGNALING_VIA_NFKB TNFAIP3
## 6 TNFA_SIGNALING_VIA_NFKB PTGS2egmt <- GSEA(geneList, TERM2GENE=geneset,verbose=F,pvalueCutoff = 0.5)
#结果转化
y=data.frame(egmt)
head(y)## ID Description setSize
## COMPLEMENT COMPLEMENT COMPLEMENT 63
## MYC_TARGETS_V1 MYC_TARGETS_V1 MYC_TARGETS_V1 78
## COAGULATION COAGULATION COAGULATION 18
## ALLOGRAFT_REJECTION ALLOGRAFT_REJECTION ALLOGRAFT_REJECTION 74
## XENOBIOTIC_METABOLISM XENOBIOTIC_METABOLISM XENOBIOTIC_METABOLISM 27
## CHOLESTEROL_HOMEOSTASIS CHOLESTEROL_HOMEOSTASIS CHOLESTEROL_HOMEOSTASIS 15
## enrichmentScore NES pvalue p.adjust
## COMPLEMENT -0.5517855 -2.208229 3.762355e-06 0.0001504942
## MYC_TARGETS_V1 0.3890339 2.100255 3.143138e-05 0.0006286276
## COAGULATION -0.6891525 -2.091602 3.128641e-04 0.0041715210
## ALLOGRAFT_REJECTION 0.3042984 1.651046 6.952398e-03 0.0695239831
## XENOBIOTIC_METABOLISM -0.4935005 -1.660739 2.555053e-02 0.2000333389
## CHOLESTEROL_HOMEOSTASIS -0.5592873 -1.613931 3.328452e-02 0.2000333389
## qvalues rank leading_edge
## COMPLEMENT 0.0001267320 280 tags=44%, list=16%, signal=39%
## MYC_TARGETS_V1 0.0005293706 672 tags=69%, list=38%, signal=45%
## COAGULATION 0.0035128598 241 tags=56%, list=13%, signal=49%
## ALLOGRAFT_REJECTION 0.0585465121 76 tags=22%, list=4%, signal=22%
## XENOBIOTIC_METABOLISM 0.1684491275 638 tags=70%, list=36%, signal=46%
## CHOLESTEROL_HOMEOSTASIS 0.1684491275 137 tags=40%, list=8%, signal=37%
## core_enrichment
## COMPLEMENT ATOX1/GNAI2/PFN1/LTA4H/CTSH/DUSP6/CD55/CTSD/PLEK/CTSB/GCA/C1QA/ANXA5/CTSL/RHOG/PLAUR/CTSC/CASP1/LGALS3/CDA/LYN/TIMP1/CEBPB/S100A9/SERPINA1/CTSS/FCN1/FCER1G
## MYC_TARGETS_V1 RPLP0/NPM1/RPS3/RPS6/RPS5/RPS10/EEF1B2/SRSF7/MYC/RPL22/BUB3/RPL14/RPL34/SNRPD2/RPL18/RPL6/RPS2/CNBP/ODC1/SRM/SRSF2/YWHAQ/PSMD14/CCT2/DDX18/FBL/HNRNPR/SERBP1/HSPE1/HPRT1/HDDC2/APEX1/HNRNPA1/C1QBP/HSPD1/RAN/PRDX3/HNRNPA3/VDAC3/ACP1/DUT/HNRNPC/G3BP1/RSL1D1/LSM2/RANBP1/SRSF3/UBA2/TCP1/PRPF31/HNRNPA2B1/SNRPA/HNRNPU/IFRD1
## COAGULATION LTA4H/CTSH/DUSP6/PLEK/CTSB/RAC1/C1QA/TIMP1/SERPINA1/CFD
## ALLOGRAFT_REJECTION CD3D/LTB/CD3E/CD2/LCK/CD7/CCL5/TRAT1/CD3G/NPM1/CD247/IL2RG/CD40LG/RPL9/RPS3A/SIT1
## XENOBIOTIC_METABOLISM COMT/IRF8/PGD/ID2/GCH1/TNFRSF1A/ALDH2/CBR1/KYNU/BLVRB/FBP1/DDAH2/GSTO1/CAT/TMEM176B/MT2A/NINJ1/HMOX1/CDA
## CHOLESTEROL_HOMEOSTASIS GUSB/ANXA5/CXCL16/PLAUR/LGALS3/S100A115.4.2 GSEA结果可视化
#气泡图,展示geneset被激活还是抑制
dotplot(egmt,split=".sign")+facet_grid(~.sign)
## wrong orderBy parameter; set to default `orderBy = "x"`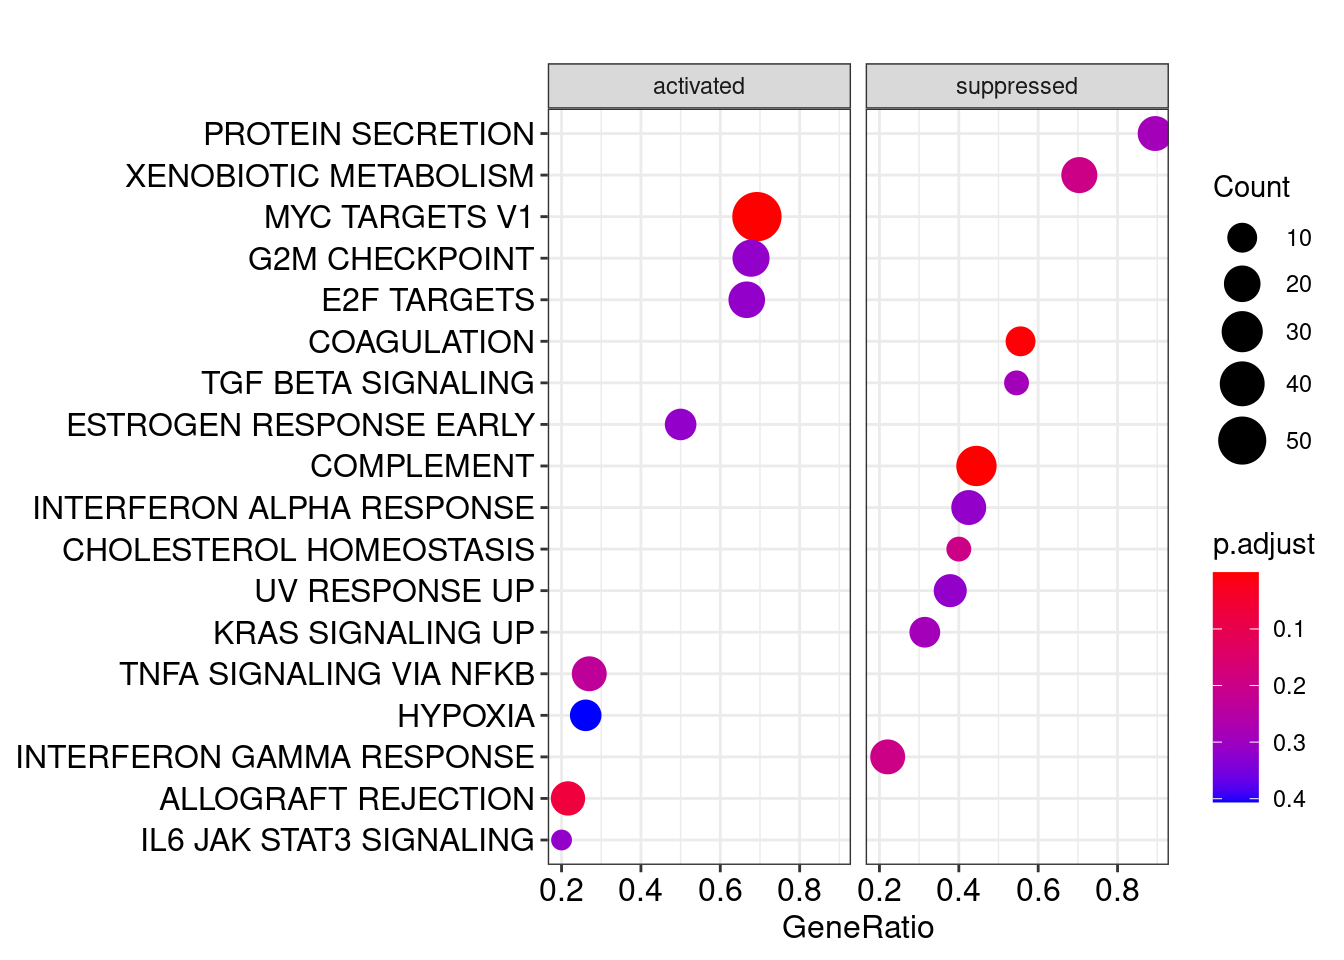
#经典gseaplot
gseaplot2(egmt, geneSetID = 1, title = egmt$Description[1])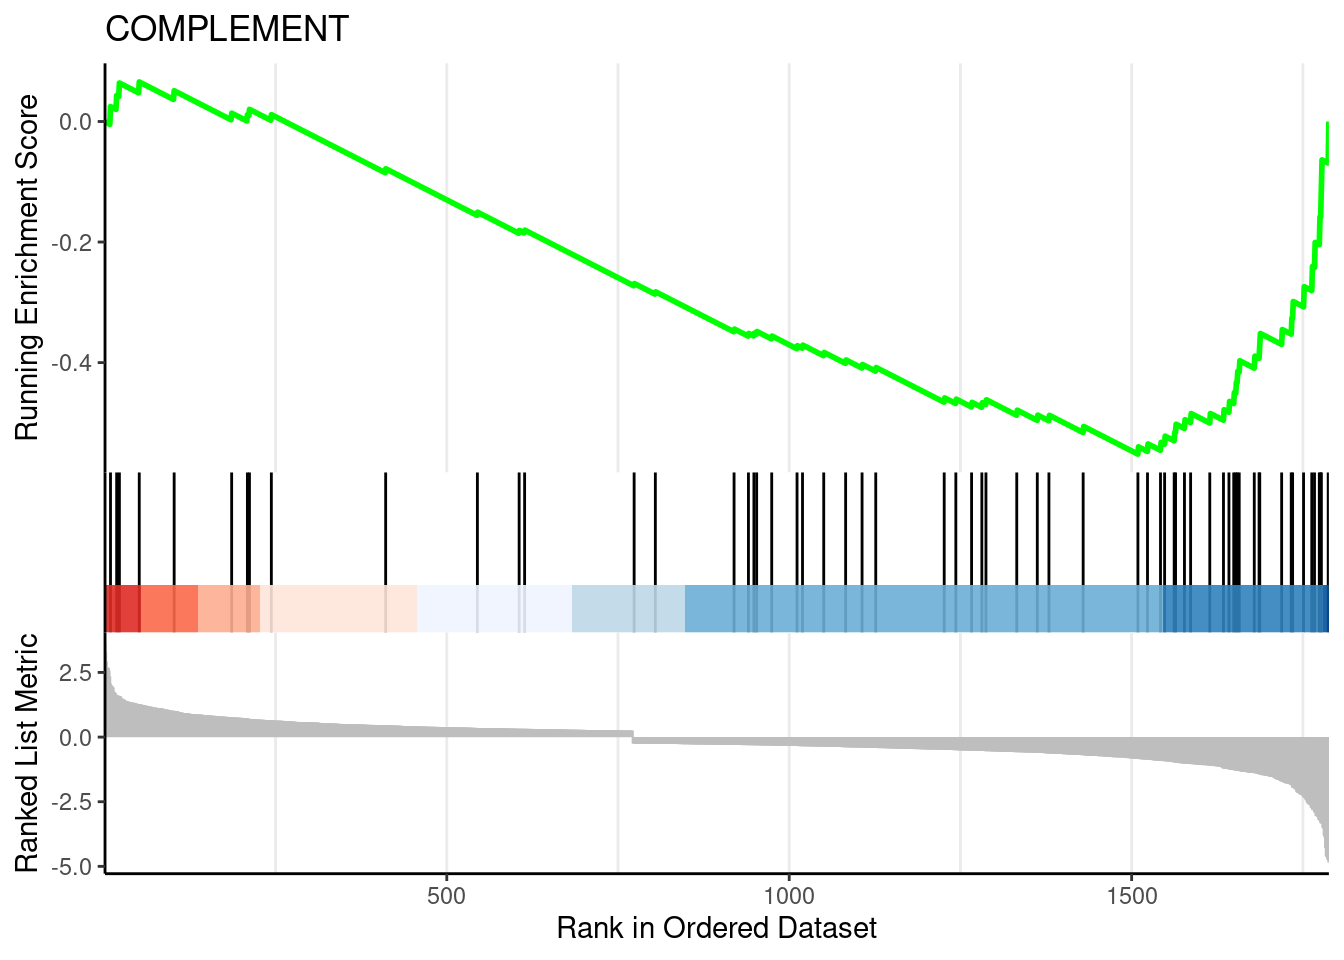
5.5 GSVA富集分析
GSVA(gene set variation analysis),通过将基因在不同样品间的表达矩阵转化成基因集在样品间的表达矩阵,从而来评估不同的代谢通路在不同样品间是否富集
富集过程主要包含一下四步: 1)评估基因i在样品j中是高表达还是低表达:累积密度函数的核估计,得到每个样本的表达水平统计 2)对每个样本的表达水平统计进行排序和标准化 3)计算每个基因集的类KS随机游走统计量 4)将类KS随机游走统计量转化为ES:最大偏离量(双峰),最大正负偏离量之差(近似正态分布)
5.5.1 GSVA富集示例
library(GSVA)
expr <- as.data.frame(pbmc@assays$RNA@data)
expr[1:10,1:10]
## PBMC_AAACATACAACCAC-1 PBMC_AAACATTGAGCTAC-1 PBMC_AAACATTGATCAGC-1
## MIR1302-10 0 0 0
## FAM138A 0 0 0
## OR4F5 0 0 0
## RP11-34P13.7 0 0 0
## RP11-34P13.8 0 0 0
## AL627309.1 0 0 0
## RP11-34P13.14 0 0 0
## RP11-34P13.9 0 0 0
## AP006222.2 0 0 0
## RP4-669L17.10 0 0 0
## PBMC_AAACCGTGCTTCCG-1 PBMC_AAACCGTGTATGCG-1 PBMC_AAACGCACTGGTAC-1
## MIR1302-10 0 0 0
## FAM138A 0 0 0
## OR4F5 0 0 0
## RP11-34P13.7 0 0 0
## RP11-34P13.8 0 0 0
## AL627309.1 0 0 0
## RP11-34P13.14 0 0 0
## RP11-34P13.9 0 0 0
## AP006222.2 0 0 0
## RP4-669L17.10 0 0 0
## PBMC_AAACGCTGACCAGT-1 PBMC_AAACGCTGGTTCTT-1 PBMC_AAACGCTGTAGCCA-1
## MIR1302-10 0 0 0
## FAM138A 0 0 0
## OR4F5 0 0 0
## RP11-34P13.7 0 0 0
## RP11-34P13.8 0 0 0
## AL627309.1 0 0 0
## RP11-34P13.14 0 0 0
## RP11-34P13.9 0 0 0
## AP006222.2 0 0 0
## RP4-669L17.10 0 0 0
## PBMC_AAACGCTGTTTCTG-1
## MIR1302-10 0
## FAM138A 0
## OR4F5 0
## RP11-34P13.7 0
## RP11-34P13.8 0
## AL627309.1 0
## RP11-34P13.14 0
## RP11-34P13.9 0
## AP006222.2 0
## RP4-669L17.10 0expr=as.matrix(expr)
kegg_list = split(geneset$gene, geneset$term)
kegg_list[1:2]## $ADIPOGENESIS
## [1] "FABP4" "ADIPOQ" "PPARG" "LIPE" "DGAT1" "LPL"
## [7] "CPT2" "CD36" "GPAM" "ADIPOR2" "ACAA2" "ETFB"
## [13] "ACOX1" "ACADM" "HADH" "IDH1" "SORBS1" "ACADS"
## [19] "UCK1" "SCP2" "DECR1" "CDKN2C" "TALDO1" "TST"
## [25] "MCCC1" "PGM1" "REEP5" "BCL2L13" "SLC25A10" "ME1"
## [31] "PHYH" "PIM3" "YWHAG" "NDUFAB1" "GPD2" "ADIG"
## [37] "ECHS1" "QDPR" "CS" "ECH1" "SLC25A1" "ACADL"
## [43] "TOB1" "GRPEL1" "CRAT" "GBE1" "CAVIN2" "SCARB1"
## [49] "PEMT" "CHCHD10" "AK2" "APOE" "UQCR10" "TANK"
## [55] "ANGPTL4" "ACO2" "FAH" "ACLY" "IFNGR1" "SLC5A6"
## [61] "JAGN1" "EPHX2" "IDH3G" "GPX3" "ELMOD3" "ORM1"
## [67] "RETSAT" "ESRRA" "HIBCH" "SUCLG1" "STAT5A" "ITGA7"
## [73] "MRAP" "PLIN2" "CYC1" "ALDH2" "RNF11" "ALDOA"
## [79] "SULT1A1" "DDT" "SDHB" "CD151" "SLC27A1" "BCKDHA"
## [85] "C3" "LEP" "ADCY6" "ELOVL6" "LTC4S" "SPARCL1"
## [91] "RMDN3" "MTCH2" "SOWAHC" "SLC1A5" "CMPK1" "REEP6"
## [97] "NDUFA5" "FZD4" "DRAM2" "MGST3" "ATP1B3" "RETN"
## [103] "STOM" "ESYT1" "GHITM" "DNAJC15" "GADD45A" "VEGFB"
## [109] "PFKL" "COQ3" "NABP1" "CYP4B1" "PPM1B" "ARAF"
## [115] "CAVIN1" "COL4A1" "IMMT" "DHRS7" "COL15A1" "NMT1"
## [121] "COQ5" "LAMA4" "AGPAT3" "BAZ2A" "IDH3A" "LIFR"
## [127] "PREB" "PTGER3" "GPHN" "PFKFB3" "GPX4" "SSPN"
## [133] "SQOR" "MTARC2" "DLD" "ITIH5" "CD302" "ATL2"
## [139] "GPAT4" "LPCAT3" "TKT" "UQCRC1" "CAT" "OMD"
## [145] "DLAT" "MRPL15" "RIOK3" "RTN3" "CHUK" "G3BP2"
## [151] "SDHC" "SAMM50" "ARL4A" "SNCG" "PDCD4" "COQ9"
## [157] "APLP2" "SOD1" "PTCD3" "PHLDB1" "ENPP2" "HSPB8"
## [163] "AIFM1" "CCNG2" "PPP1R15B" "MDH2" "ABCA1" "COX7B"
## [169] "MYLK" "COX8A" "DHRS7B" "MIGA2" "MGLL" "ITSN1"
## [175] "DHCR7" "RREB1" "CMBL" "UBC" "ATP5PO" "PRDX3"
## [181] "DBT" "NDUFS3" "NKIRAS1" "RAB34" "CIDEA" "UQCRQ"
## [187] "PEX14" "BCL6" "COX6A1" "DNAJB9" "MAP4K3" "ANGPT1"
## [193] "UBQLN1" "NDUFB7" "SLC19A1" "ABCB8" "SLC66A3" "POR"
## [199] "UCP2" "UQCR11"
##
## $ALLOGRAFT_REJECTION
## [1] "PTPRC" "IL12B" "TGFB1" "IL12A" "CD3E" "CD3D"
## [7] "CD28" "LYN" "HCLS1" "IL18" "CRTAM" "IFNG"
## [13] "CD3G" "CD86" "IL10" "UBE2N" "BCL10" "CD4"
## [19] "LCK" "NCK1" "C2" "HLA-A" "ITGB2" "HLA-DQA1"
## [25] "CD1D" "CD80" "HLA-DRA" "THY1" "TLR1" "HLA-G"
## [31] "HLA-DMB" "IL7" "IL4" "TNF" "CD247" "IL2"
## [37] "HLA-DMA" "STAT1" "IRF4" "SRGN" "INHBA" "TLR3"
## [43] "ZAP70" "CD74" "CD40" "TRAF2" "B2M" "BCL3"
## [49] "LTB" "IFNGR1" "CCR5" "CD40LG" "HLA-DOA" "GLMN"
## [55] "IL6" "HLA-E" "CD2" "CCL5" "FAS" "FASLG"
## [61] "TLR6" "PF4" "TGFB2" "CD79A" "INHBB" "ELANE"
## [67] "SPI1" "MAP3K7" "IL15" "CTSS" "CD47" "PRF1"
## [73] "IL12RB1" "LCP2" "SOCS1" "CDKN2A" "STAT4" "CD7"
## [79] "HLA-DOB" "CD8A" "ICAM1" "CCL4" "GZMB" "CSF1"
## [85] "IL11" "STAB1" "IL2RA" "NLRP3" "CCND3" "EIF3A"
## [91] "SIT1" "IFNAR2" "HDAC9" "CARTPT" "TRAT1" "CCL22"
## [97] "APBB1" "FYB1" "IL1B" "TIMP1" "RPS19" "JAK2"
## [103] "KRT1" "WARS1" "IFNGR2" "CCR2" "EREG" "MMP9"
## [109] "EGFR" "IL16" "CFP" "WAS" "ITGAL" "KLRD1"
## [115] "RARS1" "TLR2" "CCND2" "IL2RG" "ETS1" "ITK"
## [121] "NCR1" "MAP4K1" "CCL19" "PSMB10" "RPL39" "EIF3J"
## [127] "ABCE1" "CD8B" "F2" "ELF4" "LY86" "FCGR2B"
## [133] "GBP2" "PRKCG" "RPS9" "MTIF2" "GZMA" "AARS1"
## [139] "CD96" "CSK" "HIF1A" "CCL2" "ICOSLG" "NPM1"
## [145] "IL4R" "CCL11" "NME1" "FLNA" "GPR65" "ACHE"
## [151] "EIF3D" "IGSF6" "F2R" "IL13" "TAP1" "DARS1"
## [157] "IRF7" "ACVR2A" "CXCR3" "PRKCB" "CXCL9" "PTPN6"
## [163] "NCF4" "UBE2D1" "LIF" "CCR1" "MBL2" "DEGS1"
## [169] "TPD52" "AKT1" "RIPK2" "IKBKB" "GCNT1" "SOCS5"
## [175] "IRF8" "TAP2" "EIF4G3" "ABI1" "CCL7" "IL2RB"
## [181] "BRCA1" "FGR" "IL18RAP" "MRPL3" "CXCL13" "CAPG"
## [187] "EIF5A" "RPS3A" "GALNT1" "ST8SIA4" "CCL13" "RPL3L"
## [193] "LY75" "TAPBP" "NOS2" "RPL9" "BCAT1" "IL9"
## [199] "IL27RA" "DYRK3"kegg1 <- gsva(expr, kegg_list, kcdf="Gaussian",method = "gsva",parallel.sz=12)## Setting parallel calculations through a MulticoreParam back-end
## with workers=12 and tasks=100.
## Estimating GSVA scores for 50 gene sets.
## Estimating ECDFs with Gaussian kernels
## Estimating ECDFs in parallel
##
|
| | 0%
|
|= | 2%
|
|=== | 4%
|
|==== | 6%
|
|====== | 8%
|
|======= | 10%
|
|======== | 12%
|
|========== | 14%
|
|=========== | 16%
|
|============= | 18%
|
|============== | 20%
|
|=============== | 22%
|
|================= | 24%
|
|================== | 26%
|
|==================== | 28%
|
|===================== | 30%
|
|====================== | 32%
|
|======================== | 34%
|
|========================= | 36%
|
|=========================== | 38%
|
|============================ | 40%
|
|============================= | 42%
|
|=============================== | 44%
|
|================================ | 46%
|
|================================== | 48%
|
|=================================== | 50%
|
|==================================== | 52%
|
|====================================== | 54%
|
|======================================= | 56%
|
|========================================= | 58%
|
|========================================== | 60%
|
|=========================================== | 62%
|
|============================================= | 64%
|
|============================================== | 66%
|
|================================================ | 68%
|
|================================================= | 70%
|
|================================================== | 72%
|
|==================================================== | 74%
|
|===================================================== | 76%
|
|======================================================= | 78%
|
|======================================================== | 80%
|
|========================================================= | 82%
|
|=========================================================== | 84%
|
|============================================================ | 86%
|
|============================================================== | 88%
|
|=============================================================== | 90%
|
|================================================================ | 92%
|
|================================================================== | 94%
|
|=================================================================== | 96%
|
|===================================================================== | 98%
|
|======================================================================| 100%kegg2 <- kegg1
kegg2[1:10,1:10]## PBMC_AAACATACAACCAC-1 PBMC_AAACATTGAGCTAC-1
## ADIPOGENESIS -0.35791459 -0.217004195
## ALLOGRAFT_REJECTION -0.23093992 -0.056665501
## ANDROGEN_RESPONSE -0.24698071 -0.166052456
## ANGIOGENESIS -0.05551034 -0.051797361
## APICAL_JUNCTION -0.05746997 0.095356739
## APICAL_SURFACE -0.10568123 -0.243974970
## APOPTOSIS -0.28076796 -0.428613559
## BILE_ACID_METABOLISM -0.01323618 -0.004775889
## CHOLESTEROL_HOMEOSTASIS -0.29203360 -0.337901574
## COAGULATION -0.11210877 -0.052089648
## PBMC_AAACATTGATCAGC-1 PBMC_AAACCGTGCTTCCG-1
## ADIPOGENESIS -0.19974647 -0.20068439
## ALLOGRAFT_REJECTION -0.20360929 -0.19464576
## ANDROGEN_RESPONSE -0.06225333 -0.24685381
## ANGIOGENESIS -0.10130833 0.27363561
## APICAL_JUNCTION 0.02150503 0.04306834
## APICAL_SURFACE -0.06189907 -0.34868601
## APOPTOSIS -0.09531318 -0.18871131
## BILE_ACID_METABOLISM 0.09536061 -0.05813957
## CHOLESTEROL_HOMEOSTASIS -0.23696223 -0.13187924
## COAGULATION -0.09289654 -0.03721555
## PBMC_AAACCGTGTATGCG-1 PBMC_AAACGCACTGGTAC-1
## ADIPOGENESIS -0.41736608 -0.23090947
## ALLOGRAFT_REJECTION -0.24839110 -0.30312300
## ANDROGEN_RESPONSE -0.18624406 -0.11226897
## ANGIOGENESIS 0.23986521 0.11545168
## APICAL_JUNCTION 0.05554962 0.06432303
## APICAL_SURFACE 0.06105414 -0.09894962
## APOPTOSIS -0.42240807 -0.32952326
## BILE_ACID_METABOLISM -0.16223440 0.04829511
## CHOLESTEROL_HOMEOSTASIS -0.28216451 -0.19718791
## COAGULATION 0.05074903 -0.02322263
## PBMC_AAACGCTGACCAGT-1 PBMC_AAACGCTGGTTCTT-1
## ADIPOGENESIS -0.26101663 -0.31655487
## ALLOGRAFT_REJECTION -0.20920469 -0.14525146
## ANDROGEN_RESPONSE -0.19701361 -0.13466390
## ANGIOGENESIS 0.03184648 0.03183292
## APICAL_JUNCTION -0.01886515 -0.10688643
## APICAL_SURFACE -0.21492544 -0.21274795
## APOPTOSIS -0.40947077 -0.23442168
## BILE_ACID_METABOLISM -0.10375464 -0.05968525
## CHOLESTEROL_HOMEOSTASIS -0.37783520 -0.24226727
## COAGULATION 0.01418585 0.05508910
## PBMC_AAACGCTGTAGCCA-1 PBMC_AAACGCTGTTTCTG-1
## ADIPOGENESIS -0.34097446 -0.282262139
## ALLOGRAFT_REJECTION -0.38120606 -0.365907151
## ANDROGEN_RESPONSE -0.26639078 -0.237912755
## ANGIOGENESIS 0.15355799 0.324644202
## APICAL_JUNCTION 0.02317564 -0.004812126
## APICAL_SURFACE -0.16543791 -0.292213844
## APOPTOSIS -0.35512722 -0.308162836
## BILE_ACID_METABOLISM -0.01218455 -0.092504836
## CHOLESTEROL_HOMEOSTASIS -0.32480210 -0.201390143
## COAGULATION 0.06547464 0.1533383235.5.2 GSVA结果可视化
meta <- as.data.frame(pbmc@meta.data[,c('orig.ident',"celltype")])
#细胞按照细胞类型排序
meta <- meta %>% arrange(meta$celltype)
kegg2 <- kegg2[,rownames(meta)]

#取各细胞类型对应的通路score的均值
identical(colnames(kegg2),rownames(meta))
## [1] TRUEkegg3 <- cbind(meta, t(kegg2)) %>% tibble::rownames_to_column()
kegg4 <- tidyr::pivot_longer(kegg3, cols=4:ncol(kegg3), "kegg", "value")
kegg5 <- dplyr::group_by(kegg4, celltype, kegg) %>% dplyr::summarise(value2=mean(value) ) %>% dplyr::ungroup()## `summarise()` has grouped output by 'celltype'. You can override using the `.groups` argument.kegg6 <- tidyr::pivot_wider(kegg5, names_from="kegg", values_from="value2") %>%
tibble::column_to_rownames(var="celltype")
library(pheatmap)
G1 <- pheatmap(kegg6,
cluster_rows = F,
cluster_cols = F,
show_rownames = T,
show_colnames = T,
color =colorRampPalette(c("blue", "white","red"))(100),
cellwidth = 10, cellheight = 15,
fontsize = 10)
5.6 sessionInfo
sessionInfo()## R version 4.0.4 (2021-02-15)
## Platform: x86_64-pc-linux-gnu (64-bit)
## Running under: Ubuntu 20.10
##
## Matrix products: default
## BLAS: /usr/lib/x86_64-linux-gnu/blas/libblas.so.3.9.0
## LAPACK: /usr/lib/x86_64-linux-gnu/lapack/liblapack.so.3.9.0
##
## locale:
## [1] LC_CTYPE=en_US.UTF-8 LC_NUMERIC=C
## [3] LC_TIME=en_GB.UTF-8 LC_COLLATE=en_US.UTF-8
## [5] LC_MONETARY=en_GB.UTF-8 LC_MESSAGES=en_US.UTF-8
## [7] LC_PAPER=en_GB.UTF-8 LC_NAME=C
## [9] LC_ADDRESS=C LC_TELEPHONE=C
## [11] LC_MEASUREMENT=en_GB.UTF-8 LC_IDENTIFICATION=C
##
## attached base packages:
## [1] grid parallel stats4 stats graphics grDevices utils
## [8] datasets methods base
##
## other attached packages:
## [1] pheatmap_1.0.12 GSVA_1.38.2 enrichplot_1.10.2
## [4] GSEABase_1.52.1 annotate_1.68.0 XML_3.99-0.6
## [7] Rgraphviz_2.34.0 topGO_2.42.0 SparseM_1.81
## [10] GO.db_3.12.1 graph_1.68.0 org.Hs.eg.db_3.12.0
## [13] AnnotationDbi_1.52.0 IRanges_2.24.1 S4Vectors_0.28.1
## [16] Biobase_2.50.0 BiocGenerics_0.36.1 clusterProfiler_3.18.1
## [19] forcats_0.5.1 stringr_1.4.0 dplyr_1.0.5
## [22] purrr_0.3.4 readr_1.4.0 tidyr_1.1.3
## [25] tibble_3.1.1 ggplot2_3.3.3 tidyverse_1.3.1
## [28] pbmc3k.SeuratData_3.1.4 SeuratData_0.2.1 SeuratObject_4.0.0
## [31] Seurat_4.0.1
##
## loaded via a namespace (and not attached):
## [1] utf8_1.2.1 reticulate_1.18
## [3] tidyselect_1.1.0 RSQLite_2.2.5
## [5] htmlwidgets_1.5.3 KEGG.db_3.2.4
## [7] BiocParallel_1.24.1 Rtsne_0.15
## [9] scatterpie_0.1.5 munsell_0.5.0
## [11] codetools_0.2-18 ica_1.0-2
## [13] future_1.21.0 miniUI_0.1.1.1
## [15] withr_2.4.2 colorspace_2.0-0
## [17] GOSemSim_2.16.1 highr_0.9
## [19] knitr_1.32 rstudioapi_0.13
## [21] ROCR_1.0-11 tensor_1.5
## [23] DOSE_3.16.0 listenv_0.8.0
## [25] MatrixGenerics_1.2.1 labeling_0.4.2
## [27] GenomeInfoDbData_1.2.4 polyclip_1.10-0
## [29] bit64_4.0.5 farver_2.1.0
## [31] downloader_0.4 parallelly_1.24.0
## [33] vctrs_0.3.7 generics_0.1.0
## [35] xfun_0.22 GenomeInfoDb_1.26.7
## [37] R6_2.5.0 graphlayouts_0.7.1
## [39] hdf5r_1.3.3 DelayedArray_0.16.3
## [41] bitops_1.0-6 spatstat.utils_2.1-0
## [43] cachem_1.0.4 fgsea_1.16.0
## [45] assertthat_0.2.1 promises_1.2.0.1
## [47] scales_1.1.1 ggraph_2.0.5
## [49] gtable_0.3.0 globals_0.14.0
## [51] goftest_1.2-2 tidygraph_1.2.0
## [53] rlang_0.4.10 splines_4.0.4
## [55] lazyeval_0.2.2 spatstat.geom_2.1-0
## [57] broom_0.7.6 BiocManager_1.30.12
## [59] yaml_2.2.1 reshape2_1.4.4
## [61] abind_1.4-5 modelr_0.1.8
## [63] backports_1.2.1 httpuv_1.5.5
## [65] qvalue_2.22.0 tools_4.0.4
## [67] bookdown_0.21 ellipsis_0.3.1
## [69] spatstat.core_2.1-2 jquerylib_0.1.3
## [71] RColorBrewer_1.1-2 ggridges_0.5.3
## [73] Rcpp_1.0.6 plyr_1.8.6
## [75] zlibbioc_1.36.0 RCurl_1.98-1.3
## [77] rpart_4.1-15 deldir_0.2-10
## [79] pbapply_1.4-3 viridis_0.6.0
## [81] cowplot_1.1.1 zoo_1.8-9
## [83] SummarizedExperiment_1.20.0 haven_2.4.0
## [85] ggrepel_0.9.1 cluster_2.1.2
## [87] fs_1.5.0 magrittr_2.0.1
## [89] data.table_1.14.0 RSpectra_0.16-0
## [91] scattermore_0.7 DO.db_2.9
## [93] lmtest_0.9-38 reprex_2.0.0
## [95] RANN_2.6.1 ggnewscale_0.4.5
## [97] fitdistrplus_1.1-3 matrixStats_0.58.0
## [99] hms_1.0.0 patchwork_1.1.1
## [101] mime_0.10 evaluate_0.14
## [103] xtable_1.8-4 readxl_1.3.1
## [105] gridExtra_2.3 compiler_4.0.4
## [107] shadowtext_0.0.7 KernSmooth_2.23-18
## [109] crayon_1.4.1 htmltools_0.5.1.1
## [111] mgcv_1.8-35 later_1.1.0.1
## [113] lubridate_1.7.10 DBI_1.1.1
## [115] tweenr_1.0.2 dbplyr_2.1.1
## [117] MASS_7.3-53.1 rappdirs_0.3.3
## [119] Matrix_1.3-2 cli_2.4.0
## [121] igraph_1.2.6 GenomicRanges_1.42.0
## [123] pkgconfig_2.0.3 rvcheck_0.1.8
## [125] plotly_4.9.3 spatstat.sparse_2.0-0
## [127] xml2_1.3.2 bslib_0.2.4
## [129] XVector_0.30.0 rvest_1.0.0
## [131] digest_0.6.27 sctransform_0.3.2
## [133] RcppAnnoy_0.0.18 spatstat.data_2.1-0
## [135] rmarkdown_2.7 cellranger_1.1.0
## [137] leiden_0.3.7 fastmatch_1.1-0
## [139] uwot_0.1.10 shiny_1.6.0
## [141] lifecycle_1.0.0 nlme_3.1-152
## [143] jsonlite_1.7.2 viridisLite_0.4.0
## [145] limma_3.46.0 fansi_0.4.2
## [147] pillar_1.6.0 lattice_0.20-41
## [149] fastmap_1.1.0 httr_1.4.2
## [151] survival_3.2-10 glue_1.4.2
## [153] png_0.1-7 bit_4.0.4
## [155] ggforce_0.3.3 stringi_1.5.3
## [157] sass_0.3.1 blob_1.2.1
## [159] memoise_2.0.0 irlba_2.3.3
## [161] future.apply_1.7.0